I think most of you might already know what "Connected Worlds" is, so I will skip the project introduction.
The whole project of Connected Worlds is developed and installed by Design I/O. Each environment in Connected Worlds runs on a separate machine with software developed with openFrameworks. There are a total of 8 Mac Pros running the whole experience. There is a total of 15 projectors used: 7 for the floor, 6 for the wall environments and 2 for the Waterfall. For the floor tracking the team are using fabric logs made out of a retro reflective fabric being tracked by three IR cameras. For the wall interactions they are doing custom hand tracking and gesture detection from above using 12 Kinects (two Kinects per environment). To eliminate perspective issues from using multiple Kinects they combined their point clouds into a single space and then use an orthographic ofCamera to look at them from a single viewpoint (cited from Filip Visnjic, 2015, CreativeApplications.Net).
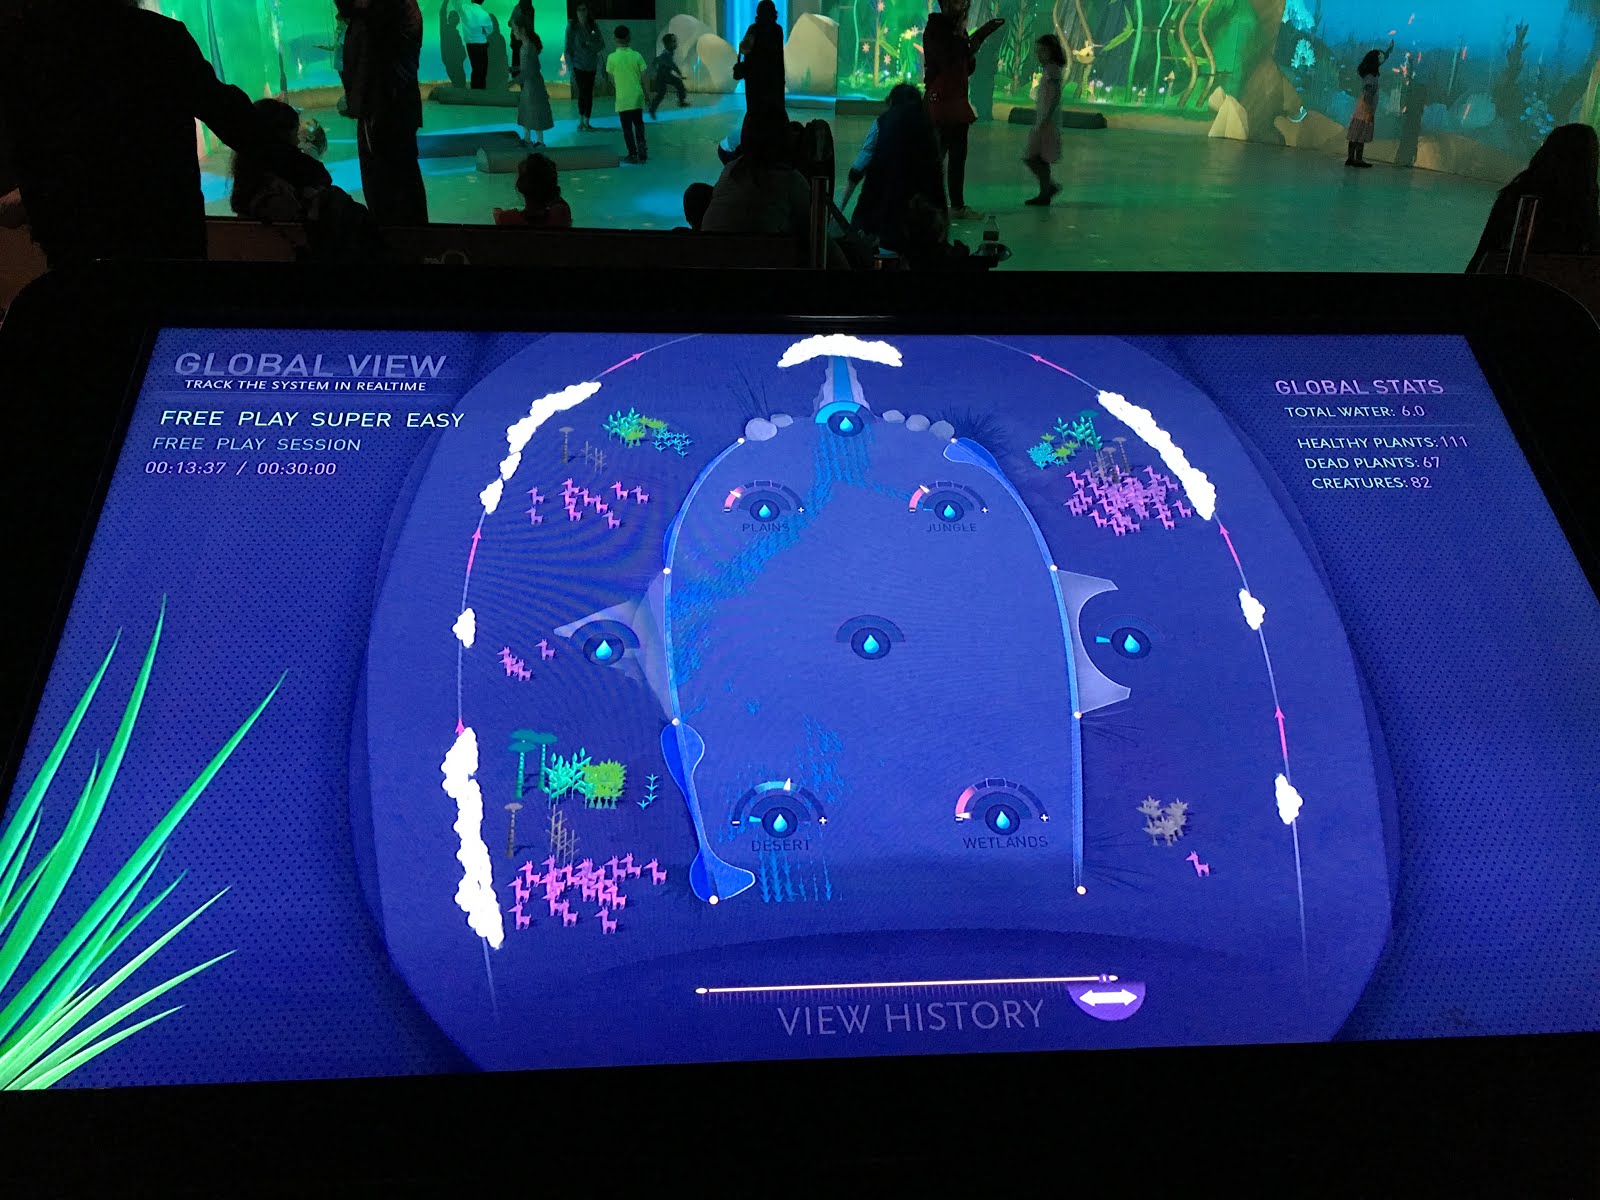
There is also another separate screen outside the interactive area of the system to show the overview of what is going on in the virtual ecosystem. As we could see in the picture, there is a slide bar below the screen to let users navigate through a whole time period when the game is played, which means those data generated in the game are both being gathered and presented in real time and also being stored in the memory.
For now, I think most people would find that the most difficult part of the system is communication. There are tons of data produced every second by users after the game starts which are not only for visualizing but also work as the important variables deciding how the game is going to go in the next second. They use OSC (Open Sound Control) protocol with the local router to connect those 8 macs in which, unlike the traditional client-server module, each device in the system could listen to all other devices' data while podcasting their own data simultaneously. All of the devices in this system are both server and client. And according to the technical director of NYSCI, the mac that controls the waterfall is treated as the main server since it does not need to process users' input (no one could literally climb the waterfall) which saves much computing power of it and has to calculate the overall water amount as a whole every frame. So basically, every data that is produced by any other device will be sent to the main waterfall computer and any other computer that also may need those data (these situations usually happens when an animal is crossing between two worlds that are processed by two different computers, shown in the picture below).

