My Phase2 paper draft could be accessed with the link below
https://drive.google.com/file/d/0BzaT4ojO4Y_AZ3JETjB4aW1VM3M/view?usp=sharing
Monday, November 21, 2016

Thursday, November 10, 2016
Answers to Question5, 6 and 8 (Drafts)
Question 5: Historical precedents for NYSCI’s work with data:
1. NYSCI is the education partner and also the founding member of the Northeast Big Data Hub. They particularly focus on developing new and accessible ways for citizens to engage with the big data and find the social phenomenon and problems behind those data. They have been working with Columbia University on the research project about how to use big data to deal with the social challenges in the fields of health care, energy, urbanization, etc.
2. NYSCI held the "Big Data Fest" on March 28th, 2015, featuring interactive experiences focused on data literacy and data gathering and visualization. They invited many guests speakers to talk about their most up-to-date work and achievements in gathering and presenting data in various ways. Besides, they did not do it in only academic ways for the scholars and big companies, NYSCI also held several workshops on the "Big Data Fest", letting New Yorkers understand how the data in New York could influence their daily lives with the hands-on experience in interacting the data with the new discoveries and research.
Reference:
http://nysci.org/event/big-data-fest/
http://nysci.org/tag/big-data/
Question 6: Types of data visualization that could help NYSCI
The data that we are going to visualize is the physical data produced on the Maker Faire that has already finished. And our job is to explain what happened at the Maker Faire and the amazing work that the participants have done to the other visitors. Therefore all the data visualization along with the introductions and annotations should be put into a website for the purpose of making it easy-to-approach for people.
Another goal of our job is to turn the physical data created by kids into the actual digital data and to visualize not only the data but also the process of how the artifact made by the kids is changed into the data. We hope through the above the process, the kids who actually participated in making those physical data would get a basic concept of what data is and how the data is composed by every single one of them. Therefore, the interaction of the visualization becomes very important which give the children the chance to explore the process.
Reference: Murray, S., 2013. Interactive data visualization for the Web. " O'Reilly Media, Inc.".
Question 8: Reflections on previous guest speakers, field trips, and other external influences that could be helpful in working with NYSCI.
The most important and inspiring experience in the previous class is the trip to the NYSCI itself and the observation of the "Connected Worlds", because it has the exact same audience and users with that of my project. And you could see more details in my last post about the "Connected Worlds"
Thursday, October 27, 2016
NYSCI TRIP
I must say that the "Connected worlds" in NYSCI is truly a magnificent media project and I am so fascinated about the implementation of it on the software engineering level. So I guess most of my post is about how the project works with different technologies and how those techniques would affect the final Data visualization and interaction.
I think most of you might already know what "Connected Worlds" is, so I will skip the project introduction.
The whole project of Connected Worlds is developed and installed by Design I/O. Each environment in Connected Worlds runs on a separate machine with software developed with openFrameworks. There are a total of 8 Mac Pros running the whole experience. There is a total of 15 projectors used: 7 for the floor, 6 for the wall environments and 2 for the Waterfall. For the floor tracking the team are using fabric logs made out of a retro reflective fabric being tracked by three IR cameras. For the wall interactions they are doing custom hand tracking and gesture detection from above using 12 Kinects (two Kinects per environment). To eliminate perspective issues from using multiple Kinects they combined their point clouds into a single space and then use an orthographic ofCamera to look at them from a single viewpoint (cited from Filip Visnjic, 2015, CreativeApplications.Net).
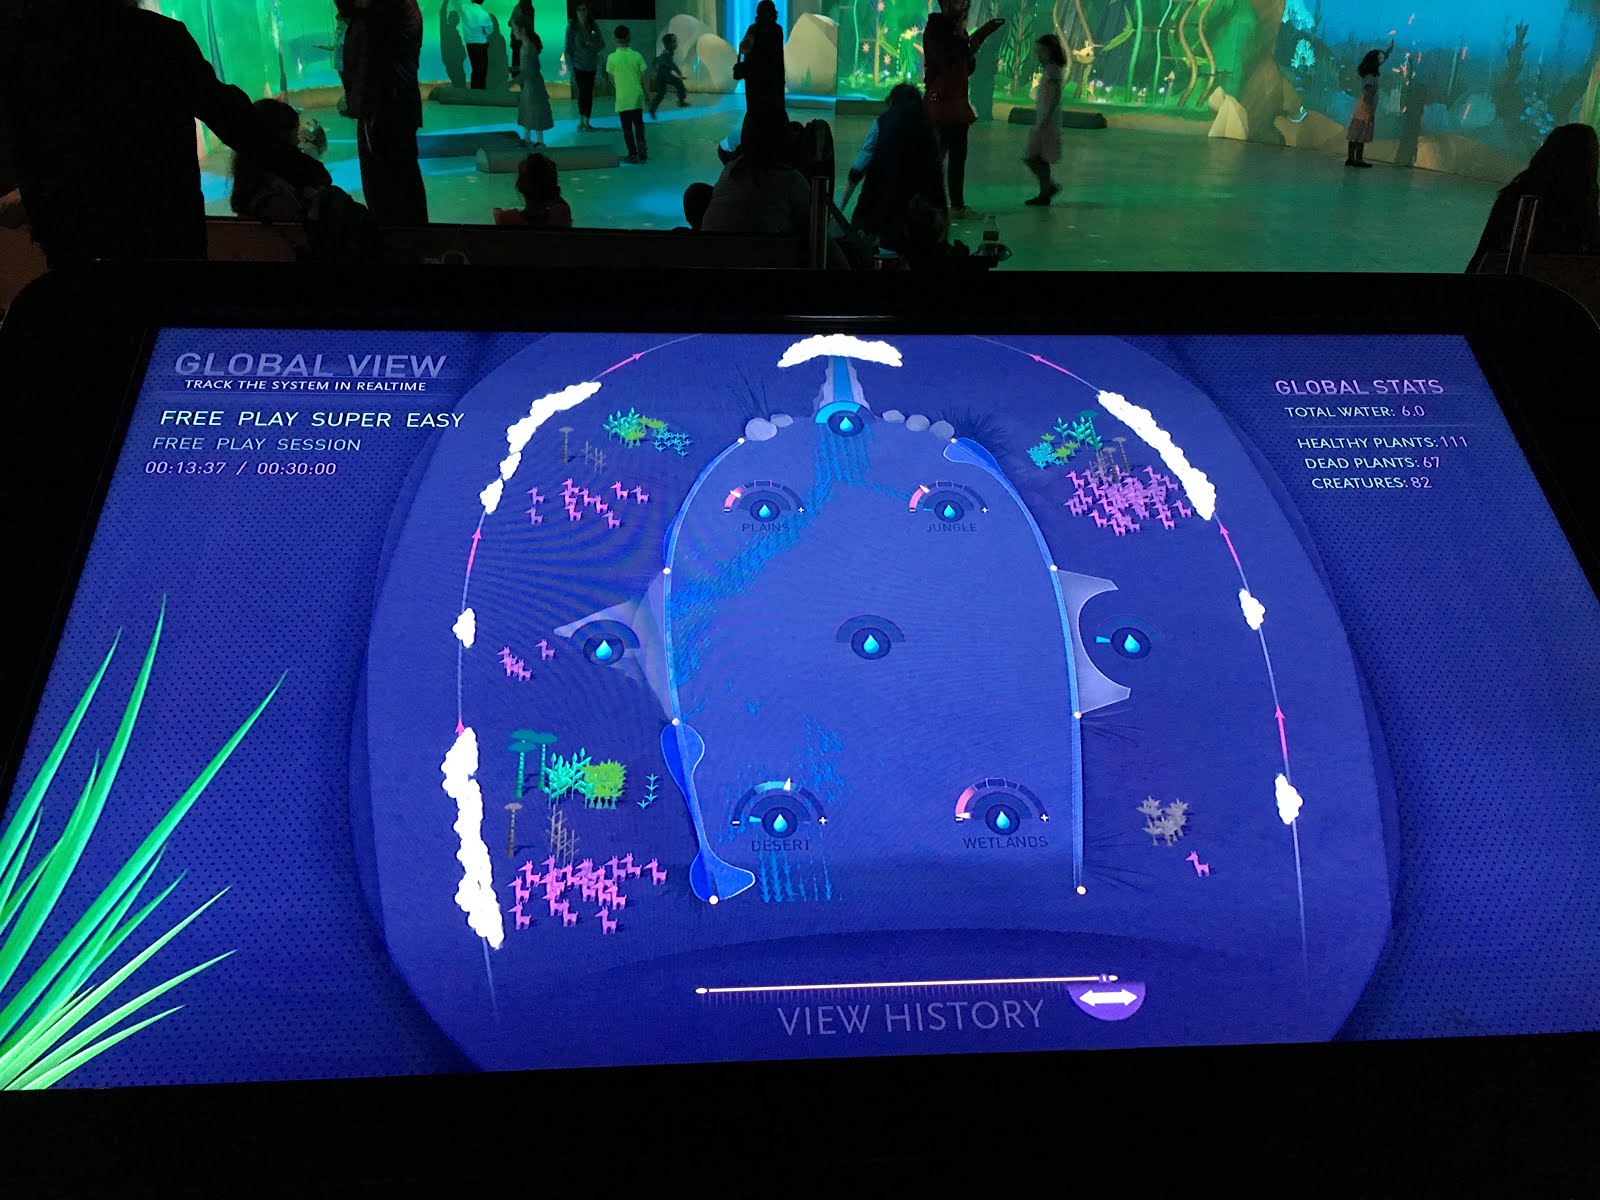
There is also another separate screen outside the interactive area of the system to show the overview of what is going on in the virtual ecosystem. As we could see in the picture, there is a slide bar below the screen to let users navigate through a whole time period when the game is played, which means those data generated in the game are both being gathered and presented in real time and also being stored in the memory.

For now, I think most people would find that the most difficult part of the system is communication. There are tons of data produced every second by users after the game starts which are not only for visualizing but also work as the important variables deciding how the game is going to go in the next second. They use OSC (Open Sound Control) protocol with the local router to connect those 8 macs in which, unlike the traditional client-server module, each device in the system could listen to all other devices' data while podcasting their own data simultaneously. All of the devices in this system are both server and client. And according to the technical director of NYSCI, the mac that controls the waterfall is treated as the main server since it does not need to process users' input (no one could literally climb the waterfall) which saves much computing power of it and has to calculate the overall water amount as a whole every frame. So basically, every data that is produced by any other device will be sent to the main waterfall computer and any other computer that also may need those data (these situations usually happens when an animal is crossing between two worlds that are processed by two different computers, shown in the picture below).

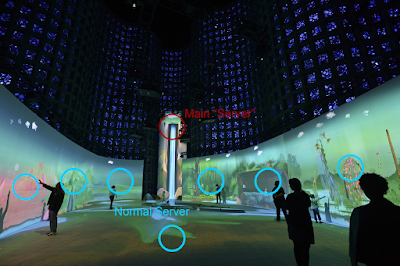 To conclude, in the Connected Worlds where huge amount data will be created and shared every frame, the developer used OSC protocol to make the devices in this system communicate with each other. And they will choose one device that has less computing burden as the main server to collect all dada in the system and prepare for the further visualization.
I think most of you might already know what "Connected Worlds" is, so I will skip the project introduction.
The whole project of Connected Worlds is developed and installed by Design I/O. Each environment in Connected Worlds runs on a separate machine with software developed with openFrameworks. There are a total of 8 Mac Pros running the whole experience. There is a total of 15 projectors used: 7 for the floor, 6 for the wall environments and 2 for the Waterfall. For the floor tracking the team are using fabric logs made out of a retro reflective fabric being tracked by three IR cameras. For the wall interactions they are doing custom hand tracking and gesture detection from above using 12 Kinects (two Kinects per environment). To eliminate perspective issues from using multiple Kinects they combined their point clouds into a single space and then use an orthographic ofCamera to look at them from a single viewpoint (cited from Filip Visnjic, 2015, CreativeApplications.Net).
There is also another separate screen outside the interactive area of the system to show the overview of what is going on in the virtual ecosystem. As we could see in the picture, there is a slide bar below the screen to let users navigate through a whole time period when the game is played, which means those data generated in the game are both being gathered and presented in real time and also being stored in the memory.
For now, I think most people would find that the most difficult part of the system is communication. There are tons of data produced every second by users after the game starts which are not only for visualizing but also work as the important variables deciding how the game is going to go in the next second. They use OSC (Open Sound Control) protocol with the local router to connect those 8 macs in which, unlike the traditional client-server module, each device in the system could listen to all other devices' data while podcasting their own data simultaneously. All of the devices in this system are both server and client. And according to the technical director of NYSCI, the mac that controls the waterfall is treated as the main server since it does not need to process users' input (no one could literally climb the waterfall) which saves much computing power of it and has to calculate the overall water amount as a whole every frame. So basically, every data that is produced by any other device will be sent to the main waterfall computer and any other computer that also may need those data (these situations usually happens when an animal is crossing between two worlds that are processed by two different computers, shown in the picture below).


Thursday, October 20, 2016
Field Trip to NYSCI
We have discussed with Catherine about the Data in the Midst project of NYSCI in maker faire. We got the initial data and information of the participants in their projects: a number of people in the different time period and their selection when doing the Data in the Midst project.
However, the biggest issue I think is all the data they gathered are hand-written. We have to manually input all of them into our computer to make a digital version of them.
Another thing is that since our meeting was after the field trip, we did not have enough time to discuss all the details about their data. So we decided to go to NYSCI next week to talk to Catherine again.
So I think we will discuss the Phase 2 background question with Catherine via email on 21th.
After the 2nd meeting which is going to be on next Tuesday, we will start to clean and then try to visualize the data.
Thursday, October 13, 2016
Phase 2 - Community Partner
Mingyu and I decided to work together on the Phase 3.
So we both chose the NYSCI as our community partner on the Data in The Mist project.
We have already contacted Catherine via email and we decided to discuss more details on Oct. 20th when we visit there.
So we both chose the NYSCI as our community partner on the Data in The Mist project.
We have already contacted Catherine via email and we decided to discuss more details on Oct. 20th when we visit there.
Wednesday, October 5, 2016
Phase 1 Project Demo
The video is the screen recording of my phase 1 project.
Tap the different bar of each state will give you the specific reform detail on the right.
The original website for doing AR is http://projects.propublica.org/graphics/workers-comp-reform-by-state?state=
You can download the ipa at here.
Tap the different bar of each state will give you the specific reform detail on the right.
The original website for doing AR is http://projects.propublica.org/graphics/workers-comp-reform-by-state?state=
You can download the ipa at here.
Wednesday, September 21, 2016
Assignment 2: The Questions to ProPublica and The Exercise Demo
My questions are:
1. Have the ProPublica done some user studies and evaluations about how each ways of data visualizations would effect the readers reading experince differently?
2. If the answer to the first questions is no, then how do they choose how to visulize the data? It is by emperiacal experience or based on the results of some exsiting research?
I have done some 3D data visualiztion in AR with Unity and Vuforia.
The below is the video. You can jump to 2:05 to skip my introduction about the data set and to directly see my demo.
Subscribe to:
Posts (Atom)